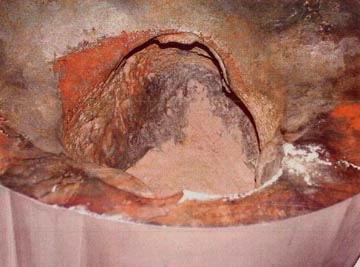
“When I first saw the 2002 photograph of the hole that was eaten into the Davis-Besse reactor (Toledo, Ohio), I could hardly believe it. We realized that we were really lucky that we did not have a nuclear accident and studies indicated that we were just a month or so away from it (potential melt down event).”
– Scott Portzline, Three Mile Island Alert

April 5, 2004 Harrisburg, Pennsylvania and Washington, D. C. – The worst American nuclear power plant accident began at 4:00 a.m. on March 28, 1979. The Unit 2 reactor at the Three Mile Island nuclear power facility near Harrisburg, Pennsylvania, overheated. Due to the loss of reactor coolant, fuel rods began to melt. Because the fuel rods were sticking up out of the lowered water level, the nuclear chain reaction could not be controlled. The rods actually melted into the remaining water, dropped to the bottom of the reactor where enough collected to start another uncontrolled nuclear chain reaction.For five days, scientists and engineers struggled to prevent the unimaginable nightmare of a core melt down that would have poisoned all the Harrisburg population with radiation. Fortunately, the nuclear chain reaction was finally stopped, but a lot of radiation was released into the atmosphere. On March 29, 1979 – the second day of the ongoing crisis – the Nuclear Regulatory Commission (NRC) reported a reading of 3,000 millirads per hour taken above Three Mile Island. The 1979 President’s Commission on Three Mile Island finally estimated that the radioactive release over thirty-one days to the environment ranged from 2.4 million to 13 million curies – or 13 megacuries.
“The total release of radioactivity to the enviroment from March 28 through April 27 has been established as 13 to 17 curies of iodine and 2.4 million to 13 million curies of noble gases.” (Page 31, Section 13, 1979 Report of the President’s Commission on the Accident at Three Mile Island.) For comparison, all combined radioactive isotope contamination at the Chernobyl melt down is estimated ato have been100 to 130 million curies, or 100 to 130 megacuries.
- Here is how the
Environmental Protection Agency (EPA) defines curies, megacuries and other curie fractions:
– Curie (Ci) is defined as 37 billion disintegrations per second.
– Megacuries (MCi) are 1 million curies (1 x 10⁶ Ci).
Megacuries are used in measuring the very large amount of radioactivity released from nuclear weapons.
– Picocuries (pCi) are 1 million millionth of a curie (1 x 10-12 Ci). Picocuries are used in measuring the typically small amount of radioactivity in air and water.
– Millicuries (mCi), or 1/1000 Ci
– Nanocuries (nCi), or 1 billionth of a curie.
– RADs and Millirads: See More Information below.
Any Evidence of Radiation Damage in Three Mile Island Region?
Higher Cancer Rates
On February 24, 1997, the National Institutes of Health issued a press release entitled “Three Mile Island Nuclear Accident Data Revisited” by Professor Steven Wing, M.D., and his colleagues at the University of North Carolina at Chapel Hill, who published their study of medical data about TMI community cancer rates in the February 24, 1997, Environmental Health Perspectives, the journal of the National Institute of Environmental Health Sciences.
“NATIONAL INSTITUTES OF HEALTH
————————————————————-
Monday, Feb. 24, 1997
12:01 AM Eastern Time
Three Mile Island Nuclear Accident Data Revisited
“Exposure to radiation after the 1979 nuclear accident at Three Mile Island may have increased cancer among some Pennsylvanians downwind of the plant, according to a recalculation of data to be published Feb. 24 in Environmental Health Perspectives, the journal of the National Institute of Environmental Health Sciences.The controversial new study was carried out by Professor Steven Wing and colleagues at the University of North Carolina at Chapel Hill. The new study involved re-analyzing data from a 1990 report that concluded the nation’s worst civilian nuclear accident was NOT responsible for excess cancers because radiation exposures were too low. However, the new analysis takes a contradictory position.
Dr. Wing comments: ‘Several hundred people at the time of the accident reported nausea, vomiting, hair loss and skin rashes, and a number said their pets died or had symptoms of radiation exposure. We figured that if that were possible, we ought to look at [the data] again. After adjusting for pre-accident cancer incidence, we found a striking increase in cancers downwind from Three Mile Island… I would be the first to say that our study doesn’t prove by itself that there were high-level radiation exposures, but it is part of a body of evidence that is consistent with high exposures.’
“In 1998, U. S. District Court Judge Sylvia Ramob dismissed more than 2,000 damage claims filed against the Davis-Besse power plant by nearby residents.”
In December 2002, the U. S. Third Circuit Court of Appeals found that the district court had erred in excluding increased incidence of lung cancer data, but declined to hear an appeal of Judge Rambo’s dismissal. Attorneys representing 1,990 remaining plaintiffs in the TMI case declared they would take no further legal action, despite their conviction that Dr. Wing’s research indicated higher cancer rates after March 29, 1979, in the Three Mile Island region.
2003 Follow-Up On TMI Cancer Rates
In November 2003, Dr. Wing published “Objectivity and Ethics in Environmental Health Science” in the journal, Environmental Health Perspectives. He described information from a spring 1987 survey of 450 people living with “unobstructed views of TMI at distances of between 3 and 8 miles.” After the TMI accident, residents who had been out-of-doors reported ” a metallic taste, nausea, vomiting, hair loss, erythema (redness of skin caused by chemical, poisoning or burn). …Residents reported 19 cancer deaths during 1980-1984 (5 year period after nuclear disaster), compared with an expected number of 2.6.”
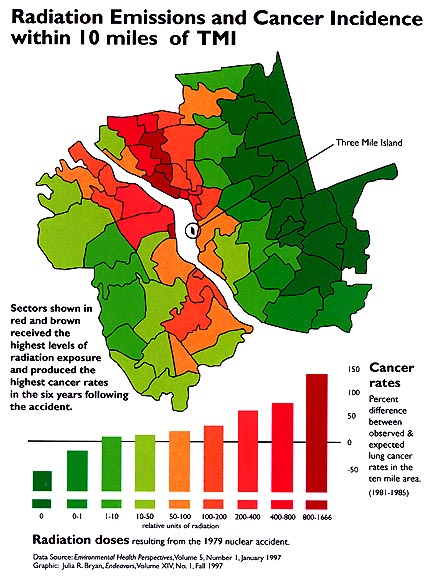
“We found positive relationships between accident dose estimates and cancer rates for all three categories of cancer (lung cancer, leukemia, childhood cancers). The slope of the dose-response estimates was largest for leukemia, intermediate for lung cancer, and smallest for all cancers. …Lung cancer showed the most consistent dose-response relationship across levels of dose. The map below shows dose estimates in relation to lung cancer rates, based on the 400 cases diagnosed in the 10-mile area during 1981-1985, adjusted for pre-accident variation in lung cancer incidence, but not for socioeconomic status. The height of the bars represents the difference between the observed numbers of cases at each dose level and the number that would have occurred if each area had experienced the average lung cancer rates of the 10-mile area population as a whole.”

Deformed Plants and Insects


